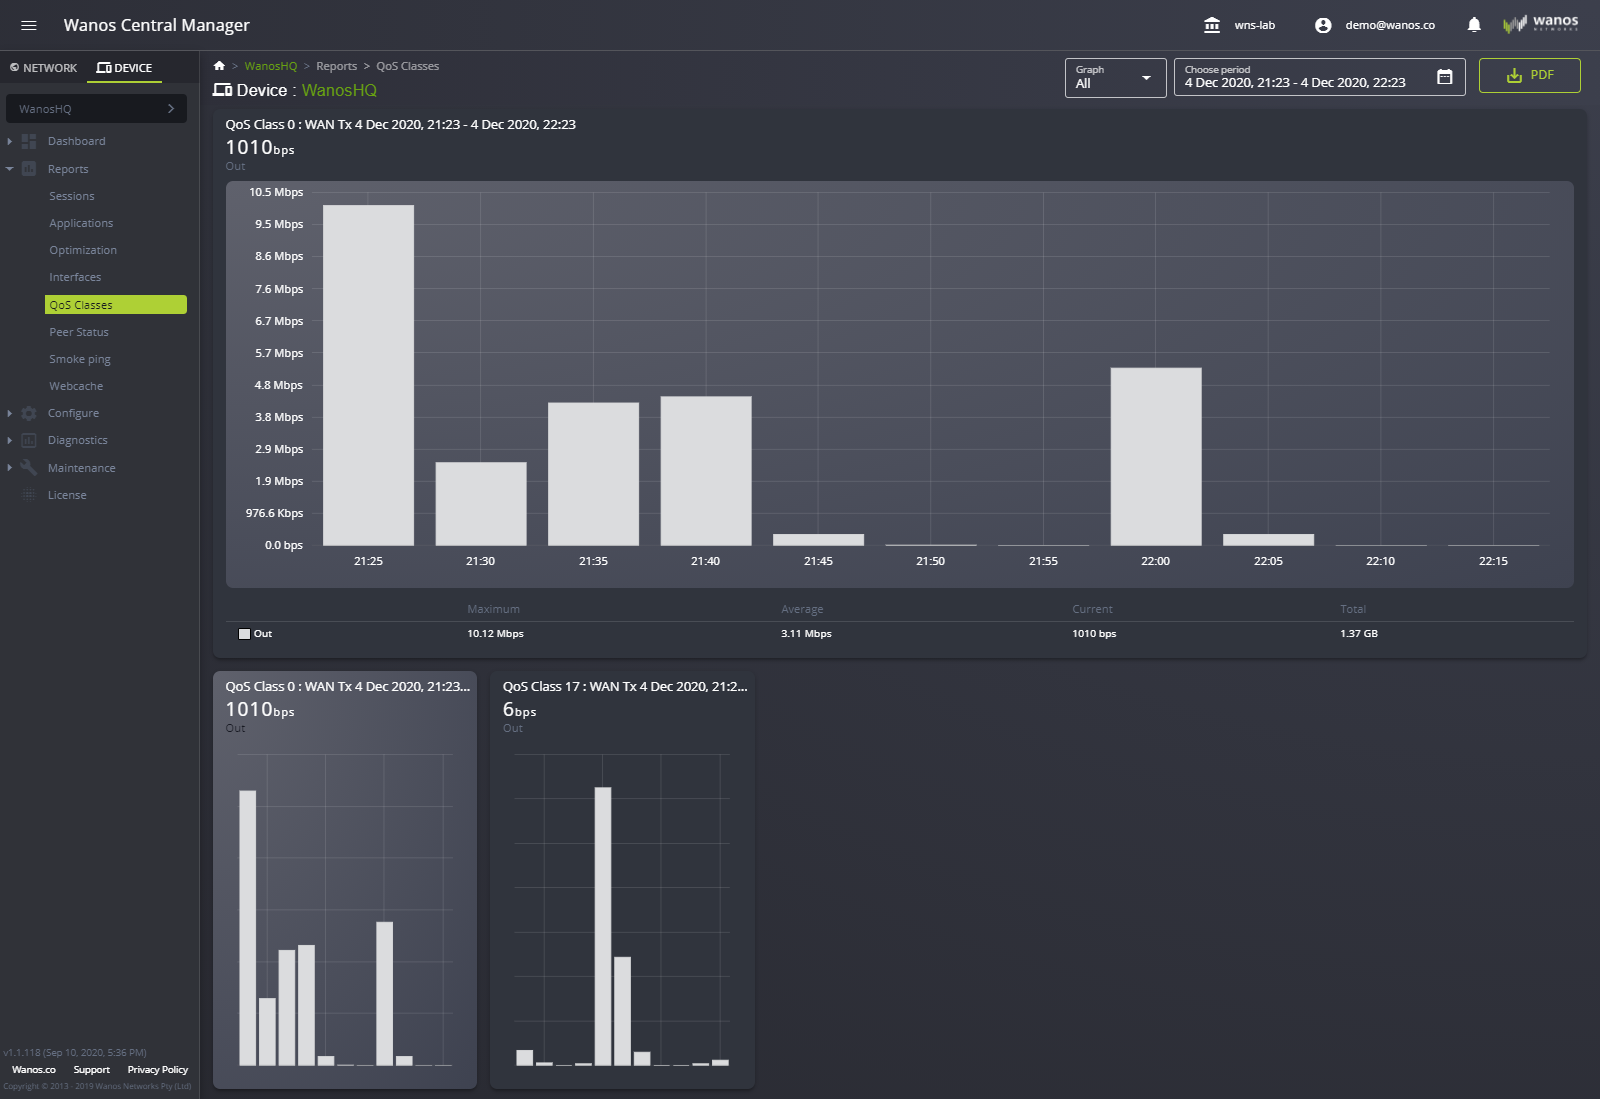
QoS Classes show traffic usage of each QoS class configured in Traffic Policies.
Use the dropdown boxes to view specific QoS classes. An option to export the report into PDF format is also available.
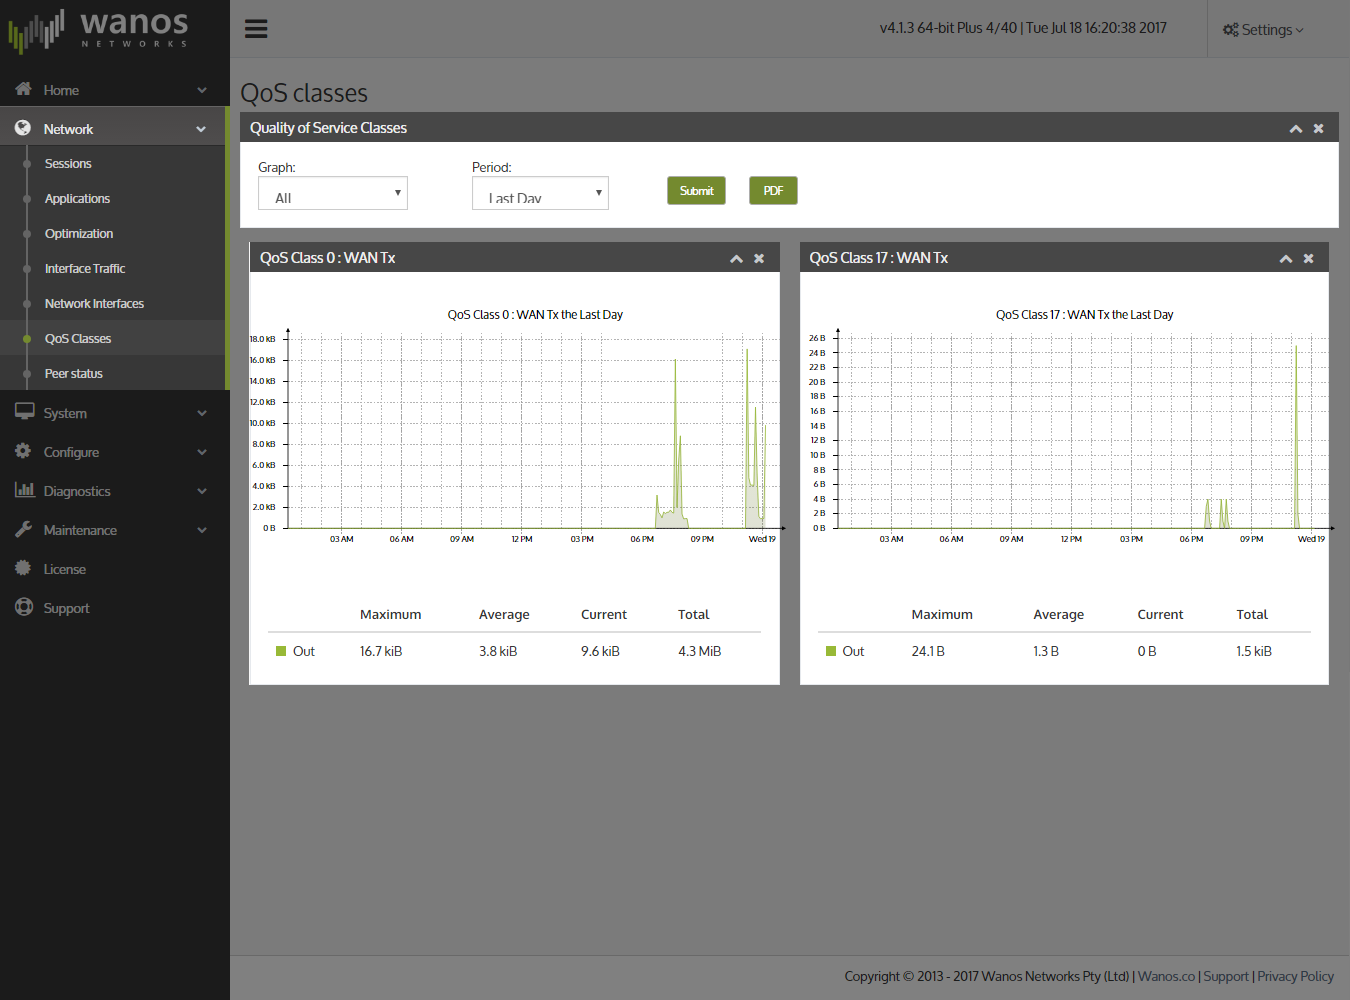
Use the dropdown boxes to view specific QoS classes. An option to export the report into PDF format is also available.