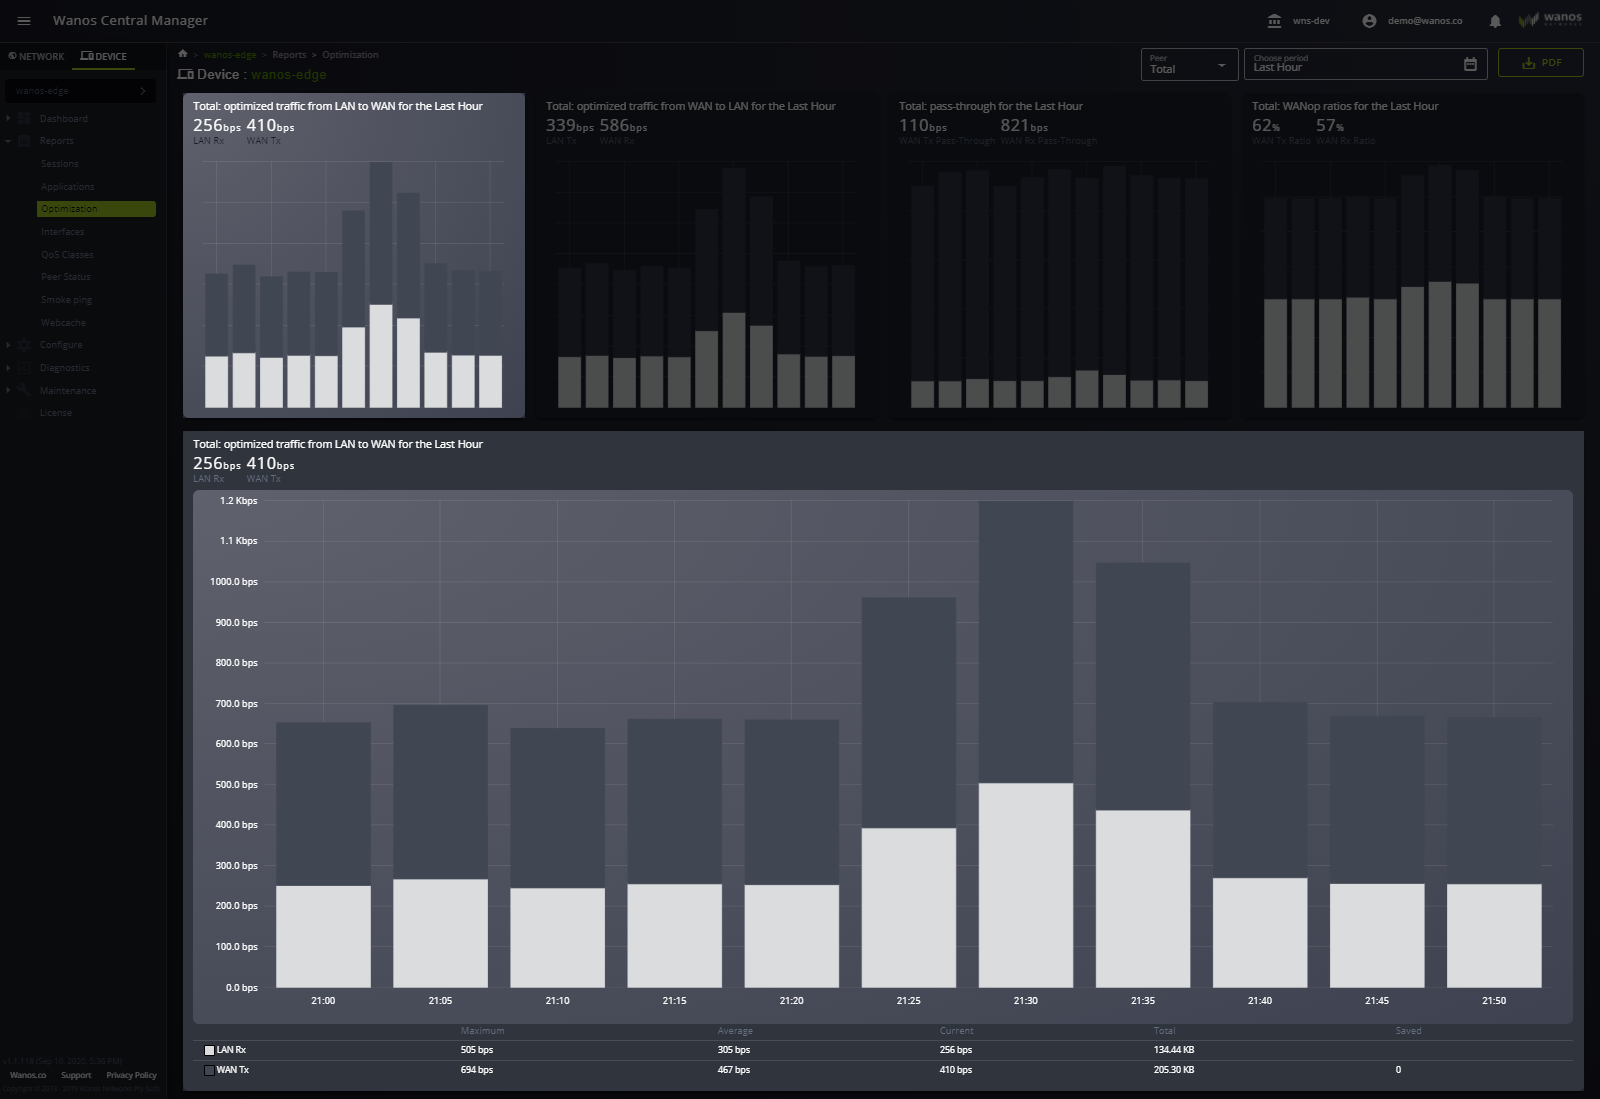
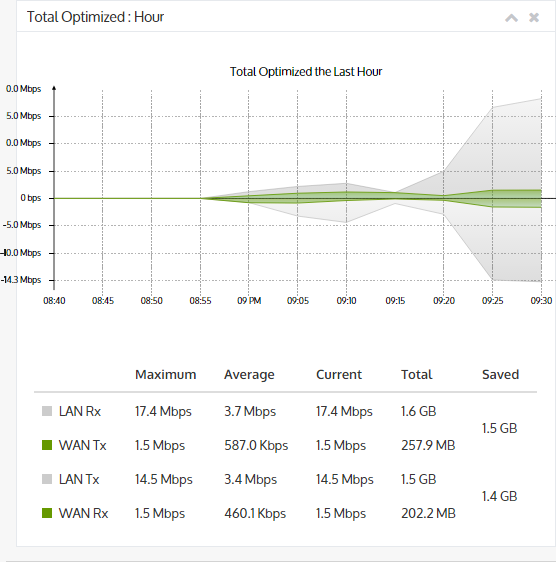
The graph displays WAN optimized traffic.
The difference between the LAN side and the WAN side traffic volume indicates the bandwidth saving generated by optimization.
Below is a graphical representation of the optimized traffic. Graph views can be modified by adjusting the Peer or by Period. A report can be generated by exporting the data into a PDF document.