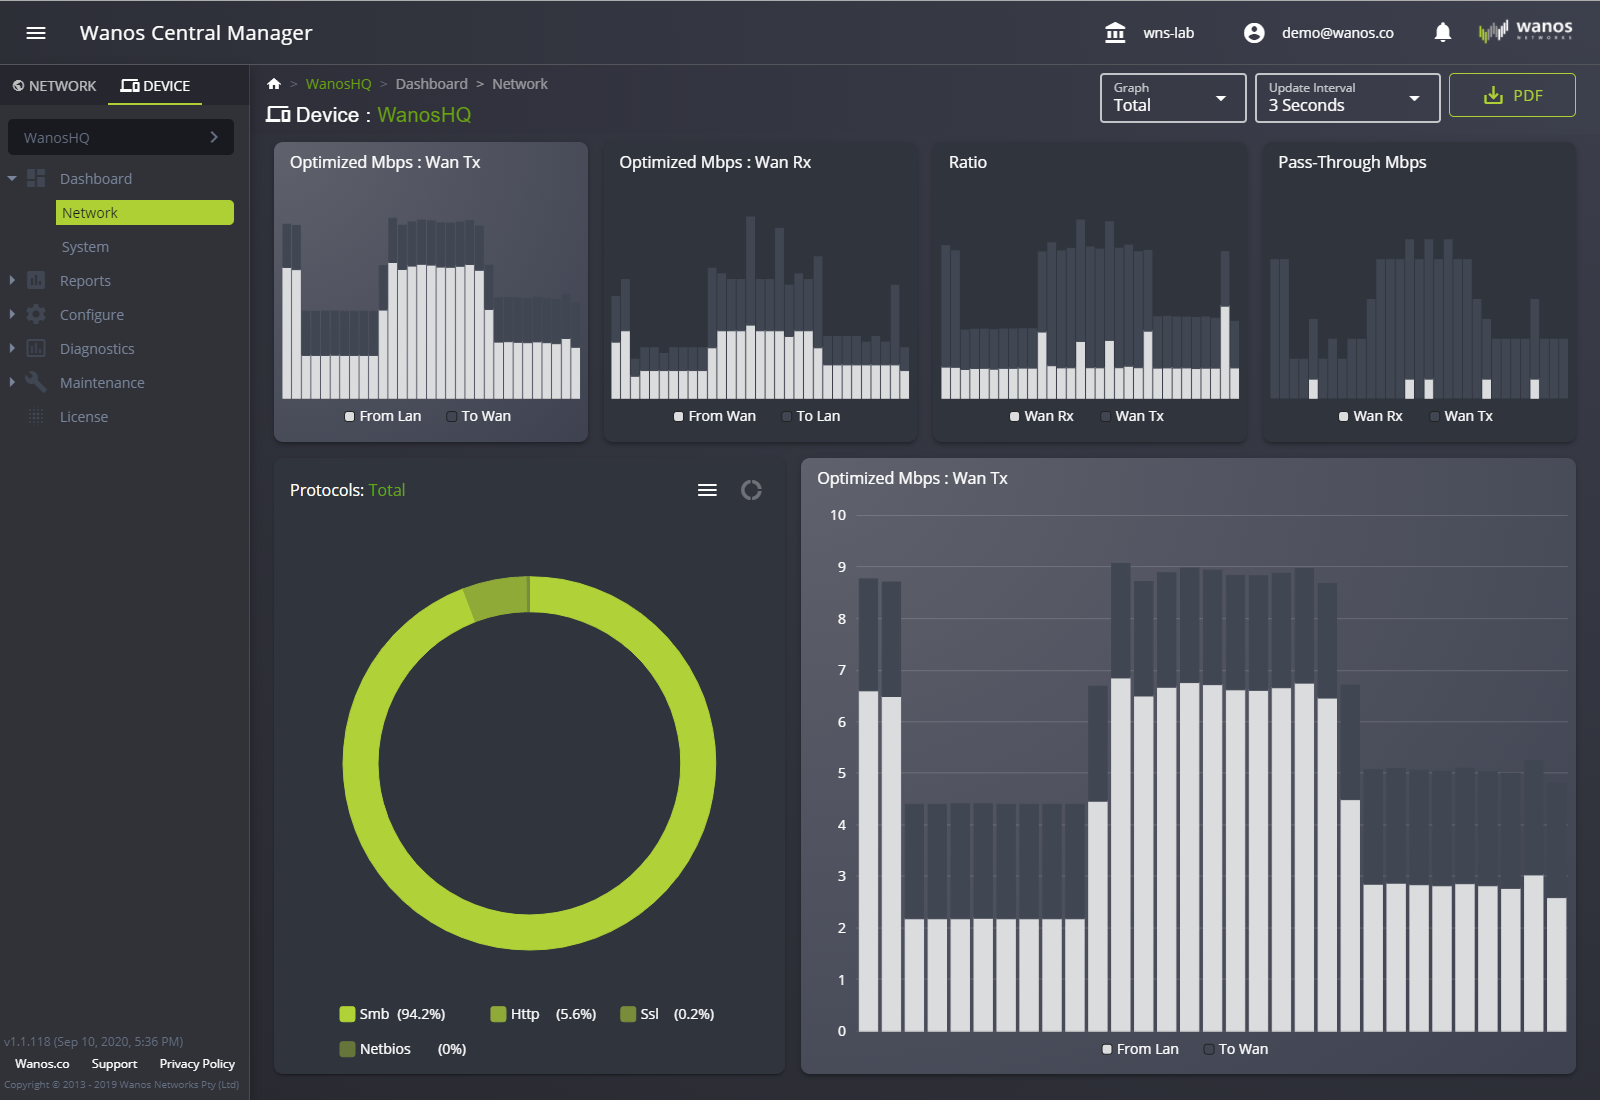
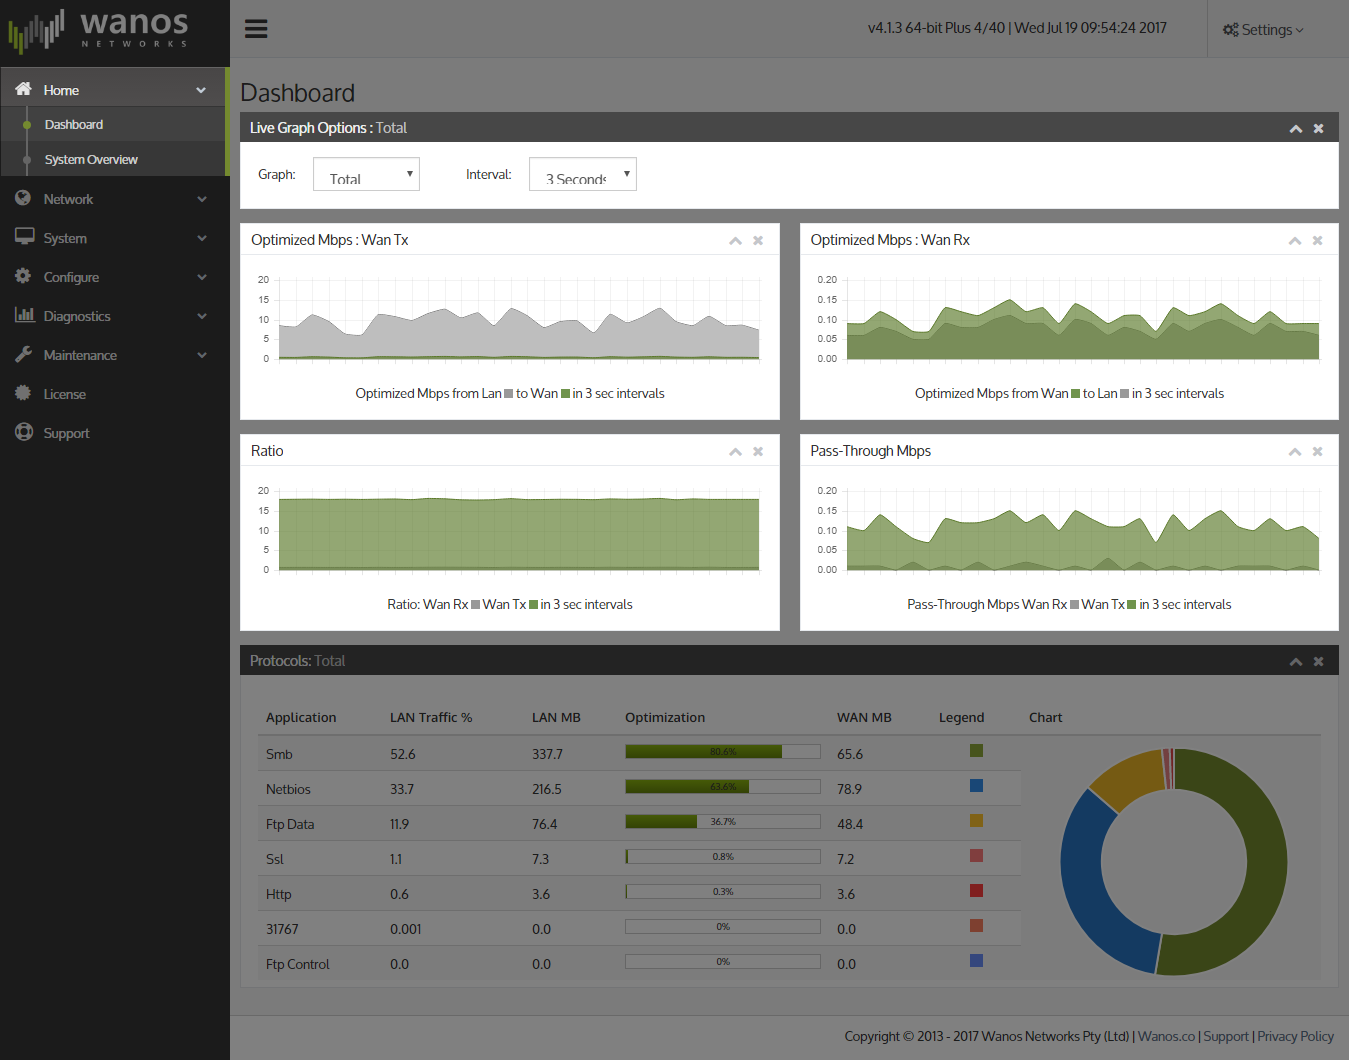
The main Web UI page displays a Dashboard that provides real-time network traffic graphs.
The Dashboard displays an overview of network traffic. Four graphs represent Optimized traffic, Passthrough traffic and optimization ratios. Graph views can be adjusted by using peers and interval options.