Dashboard
The dashboard is the one central place to monitor and connect to remote agents within the Organization.
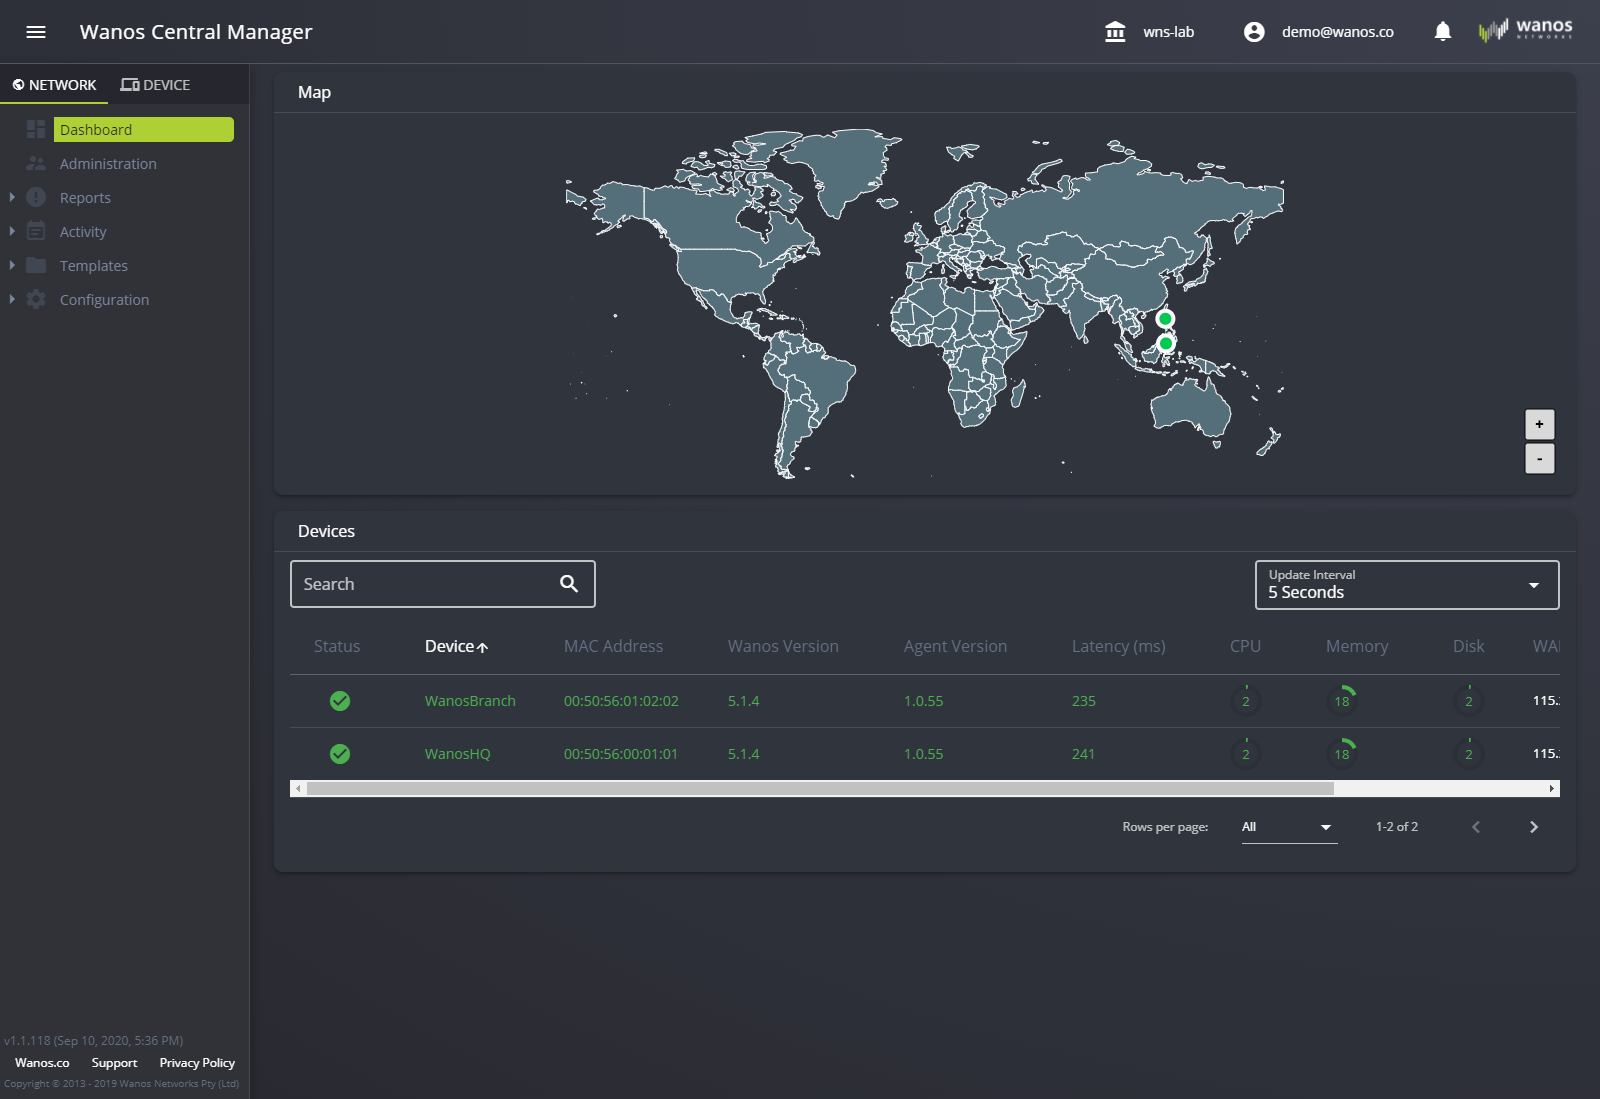
This section allows the administrator to see activated agent devices in various locations, search devices, change the number of displayed devices per page, and update the refresh interval (5 seconds, 10 seconds, 15 seconds, 30 seconds, 1 minute).
Status: It shows the status of the agent(s).
Red: Offline
Orange: Check the device’s health/warning
Green: No issue
Device: This is the name of the agent device. It uses the hostname assigned on the target device.
MAC Address: MAC ID information on the assigned device.
Wanos Version: The Wanos version running in the appliance. Example: version 4.2.9.
Agent Version: The running Agent version inside the appliance. Example: version 1.0.27. The agent will automatically download the updates once it goes online.
Latency: Latency between the device and WCM server.
CPU: The CPU utilization on the agent device.
Memory: Refers to the memory utilization on the agent device.
Disk: The disk utilization on the agent device.
WAN RX: The WAN Receive traffic on the agent device.
WAN TX: The WAN Transmit traffic on the agent device.
Manage: Clicking this button will access the target agent’s Device page.