Reports
Sessions
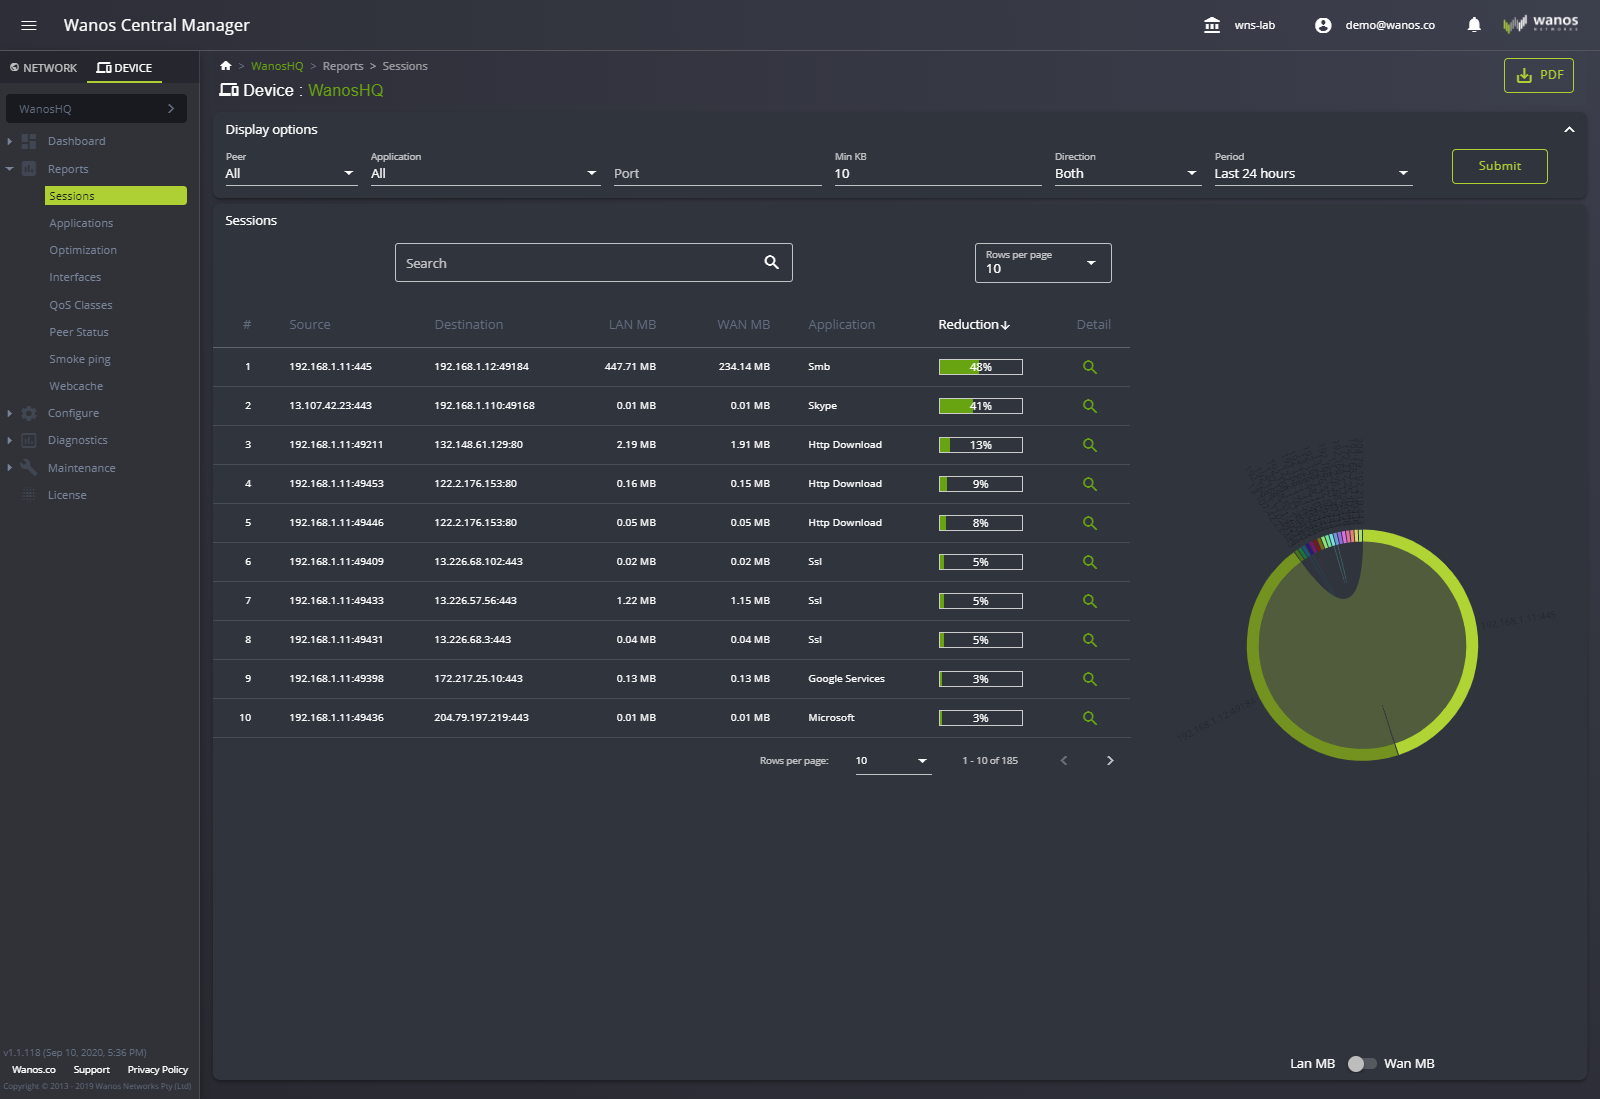
The Sessions page can show the flow of network traffic in either direction.
By default, the Peer view shows all peers but this can be modified to a per peer basis. Administrators can filter Applications, specify Port numbers, direction of flow, packet size and period. All results can be exported into a PDF report.
Applications
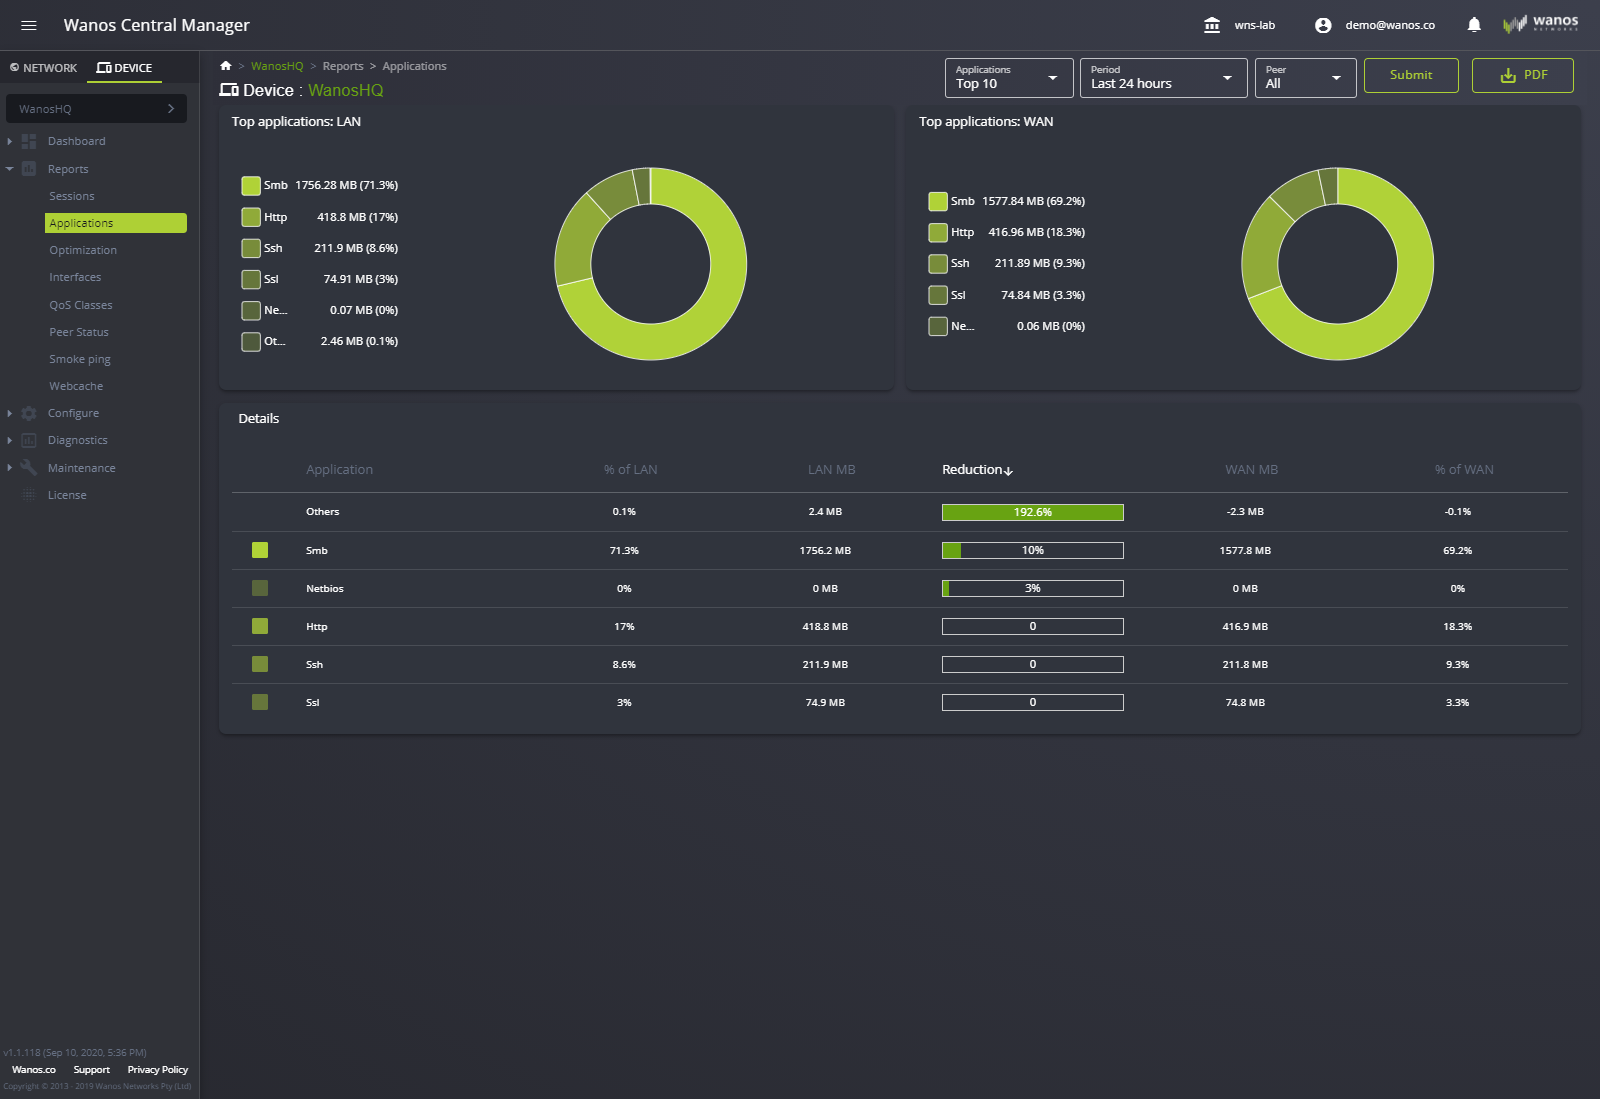
The Applications page provides the administrator with Layer 7 or Application Layer visibility into the applications on the network.
Wanos can identify over two hundred (200) Layer-7 and seven thousand (7,000) Layer-4 applications. Layer 7 QoS and visibility enables the administrator to identify, control and prioritize the top talking applications.
Use the Peer dropdown box to switch from viewing all peers to a specific peer. The period and number of displayed applications can be customized with the option to export into a PDF report.
Optimization
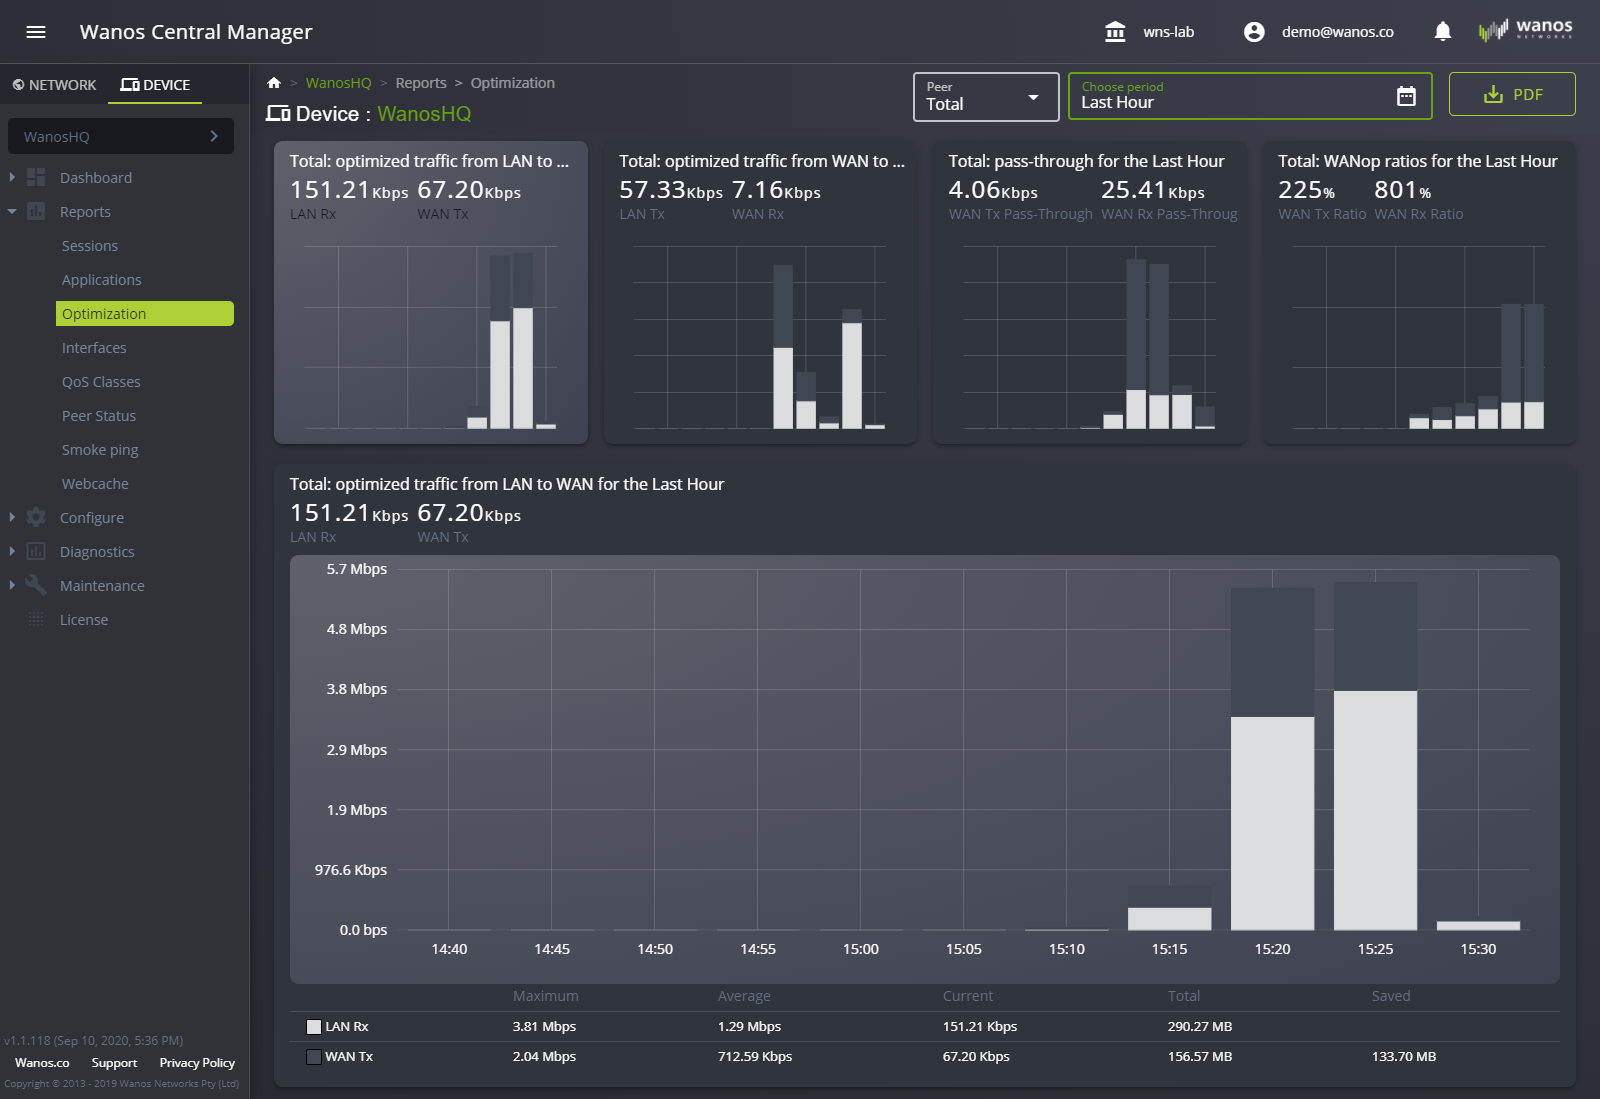
The graph displays WAN optimized traffic.
The difference between the LAN side and the WAN side traffic volume indicates the bandwidth saving generated by optimization.
Below is a graphical representation of the optimized traffic. Graph views can be modified by adjusting the Peer or by Period. A report can be generated by exporting the data into a PDF document.
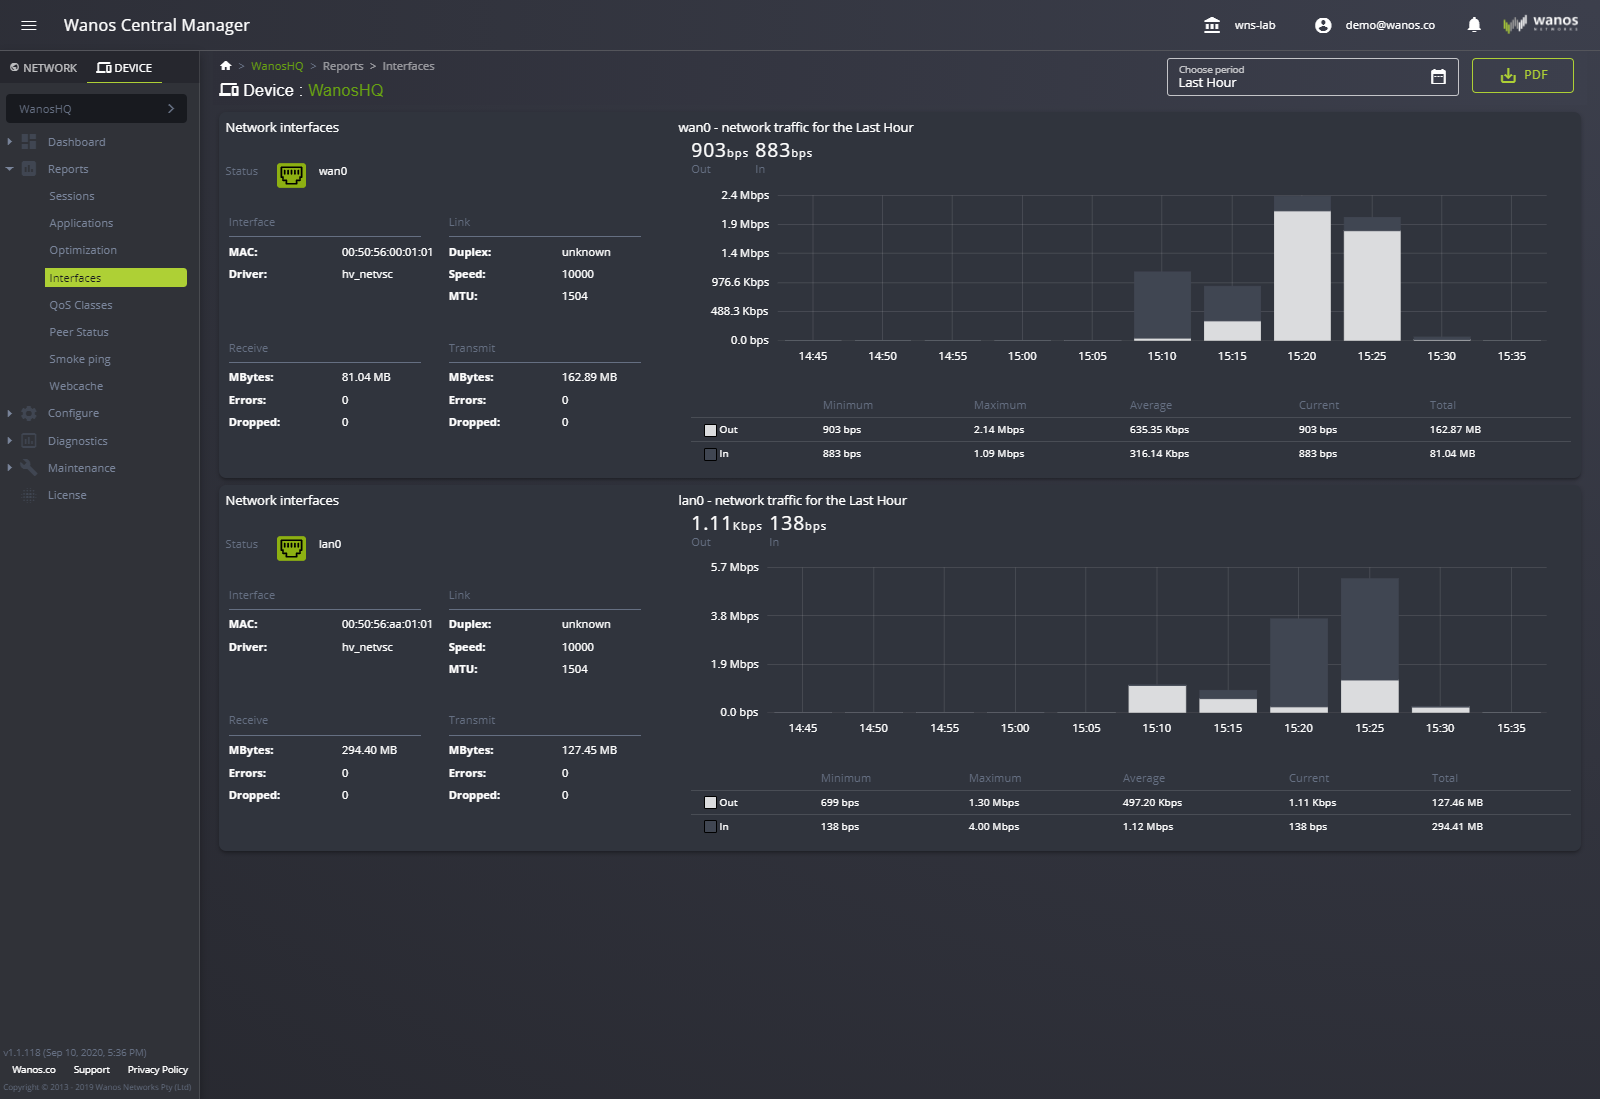
Interfaces
The interface graph displays NIC, WAN, and LAN information.
Below is a graphical representation of the interface. Graph views can be modified by adjusting the Period. A report can be generated by exporting the data into a PDF document.
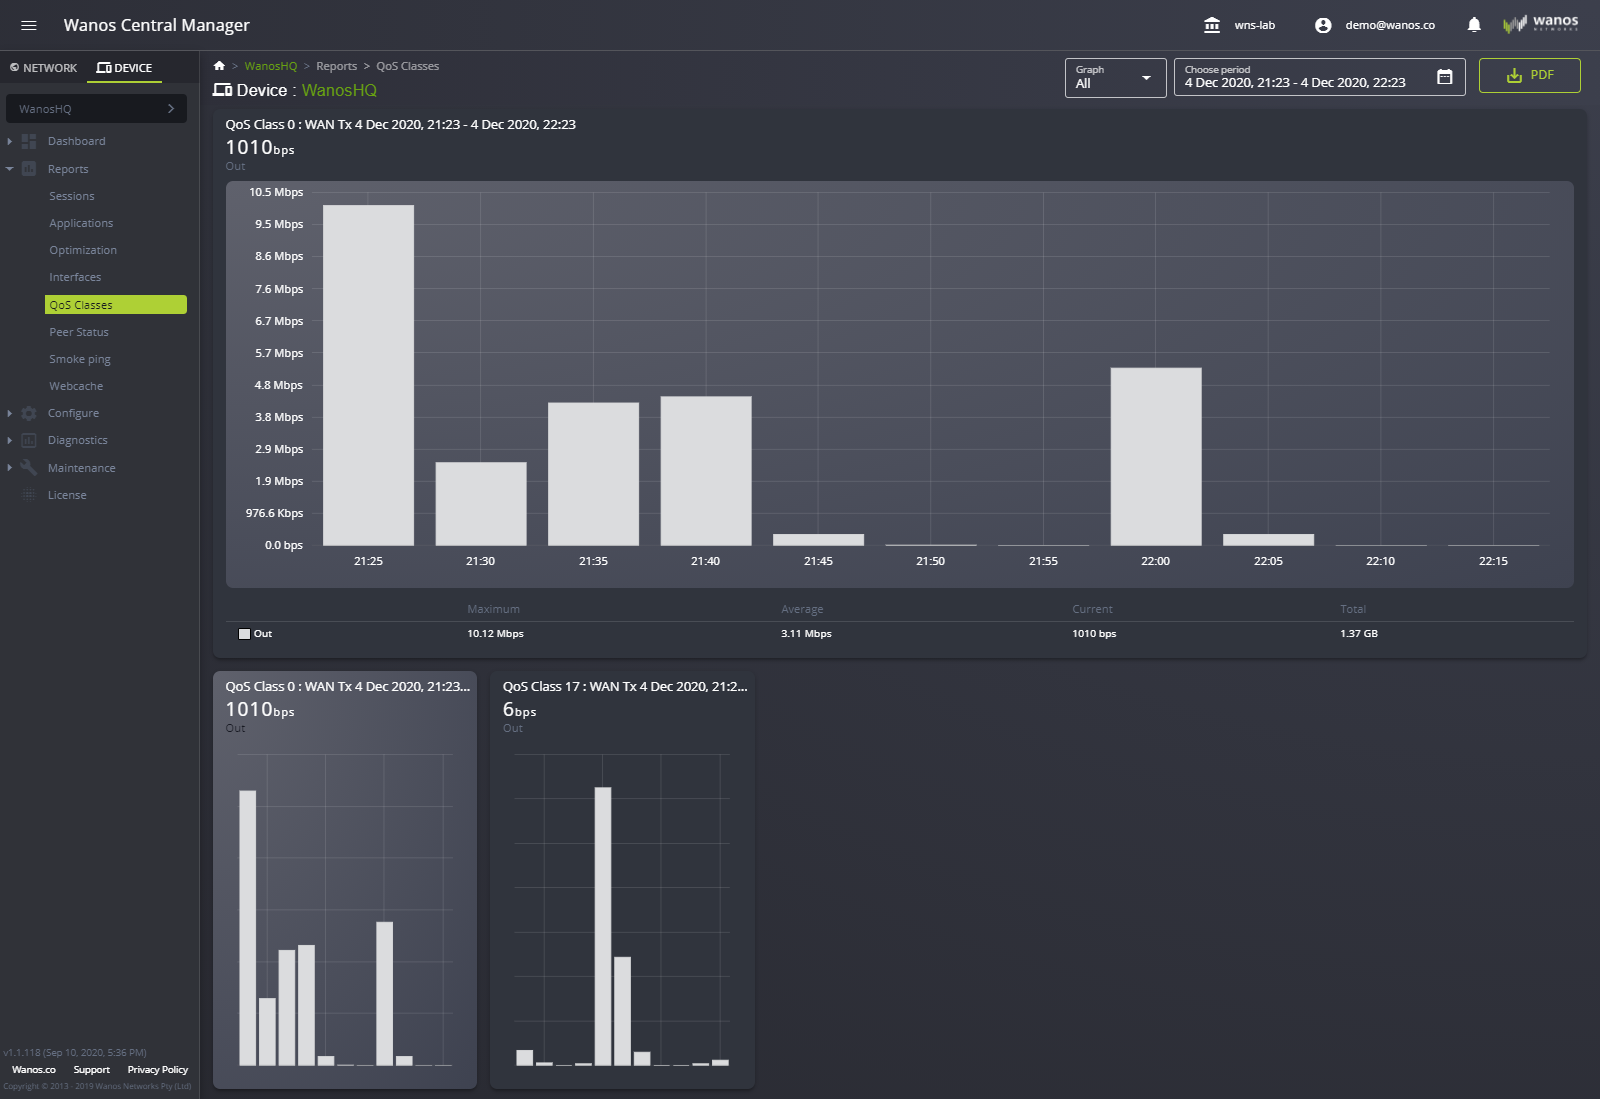
QoS Classes
QoS Classes show traffic usage of each QoS class configured in Traffic Policies.
Use the dropdown boxes to view specific QoS classes. An option to export the report into PDF format is also available.
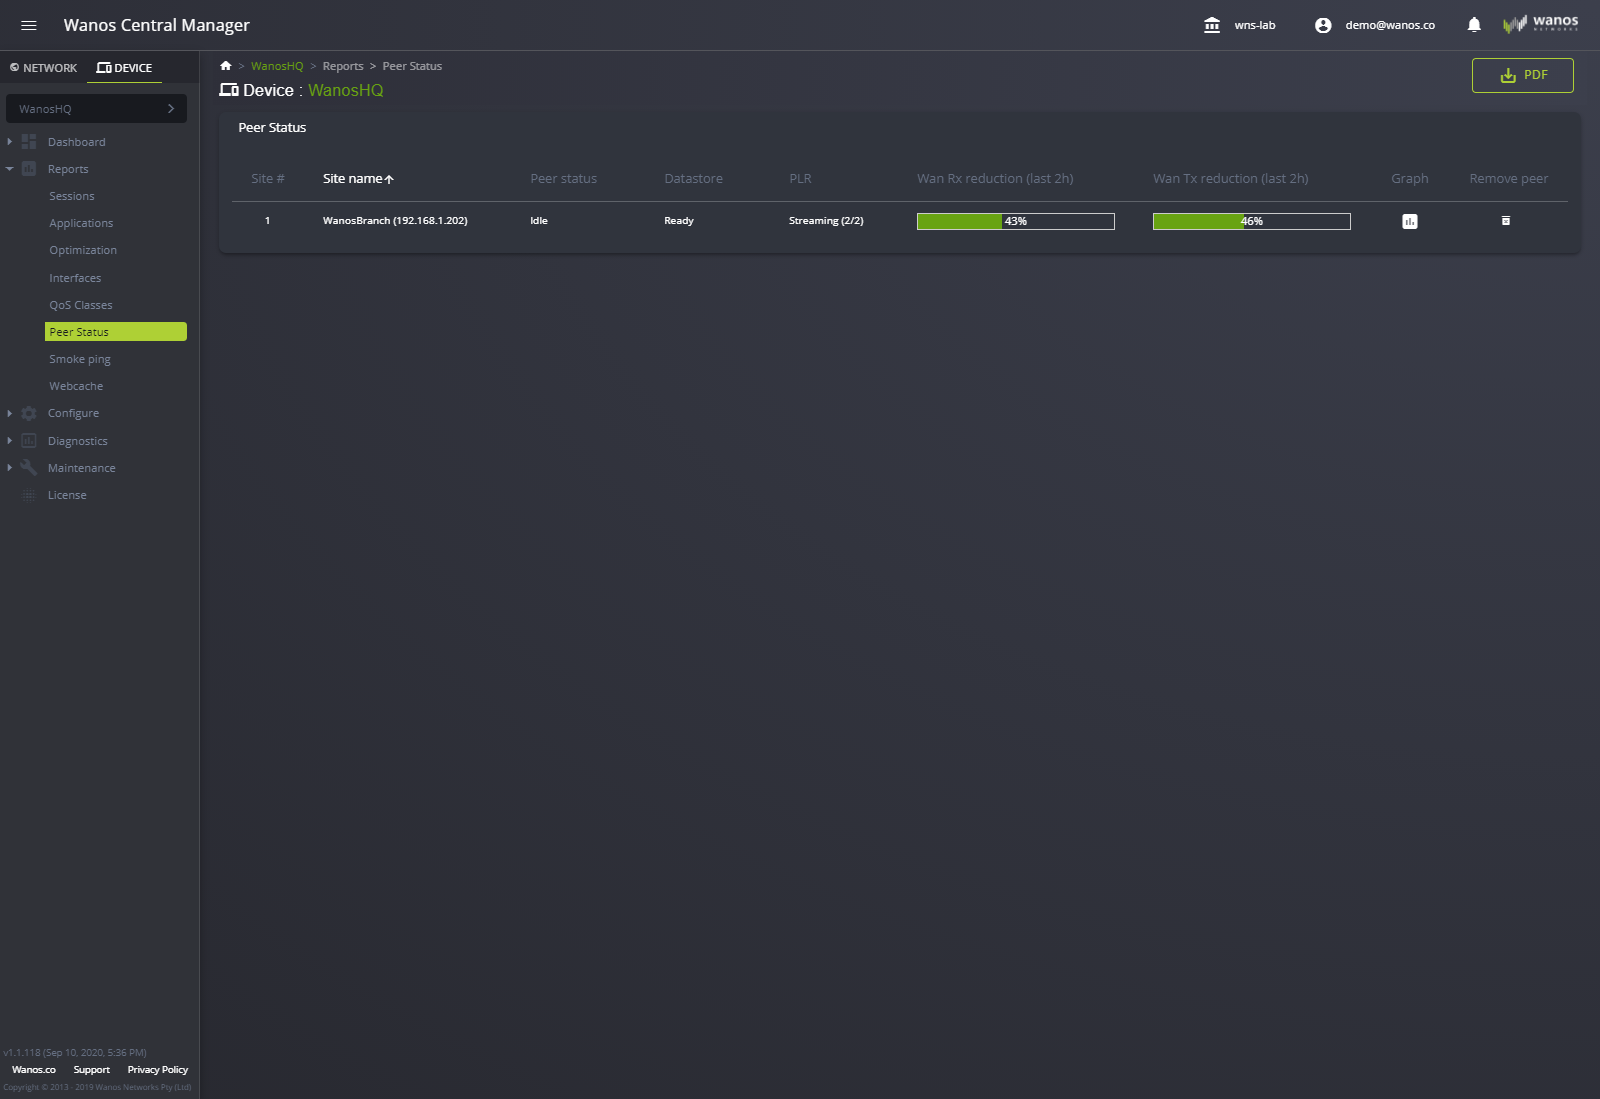
Peer Status
The page lists the available peer(s) in your network, shows their status, and a graph that points to the Optimization page. Administrators can remove peers from the list. An option to export the report into PDF format is also available.
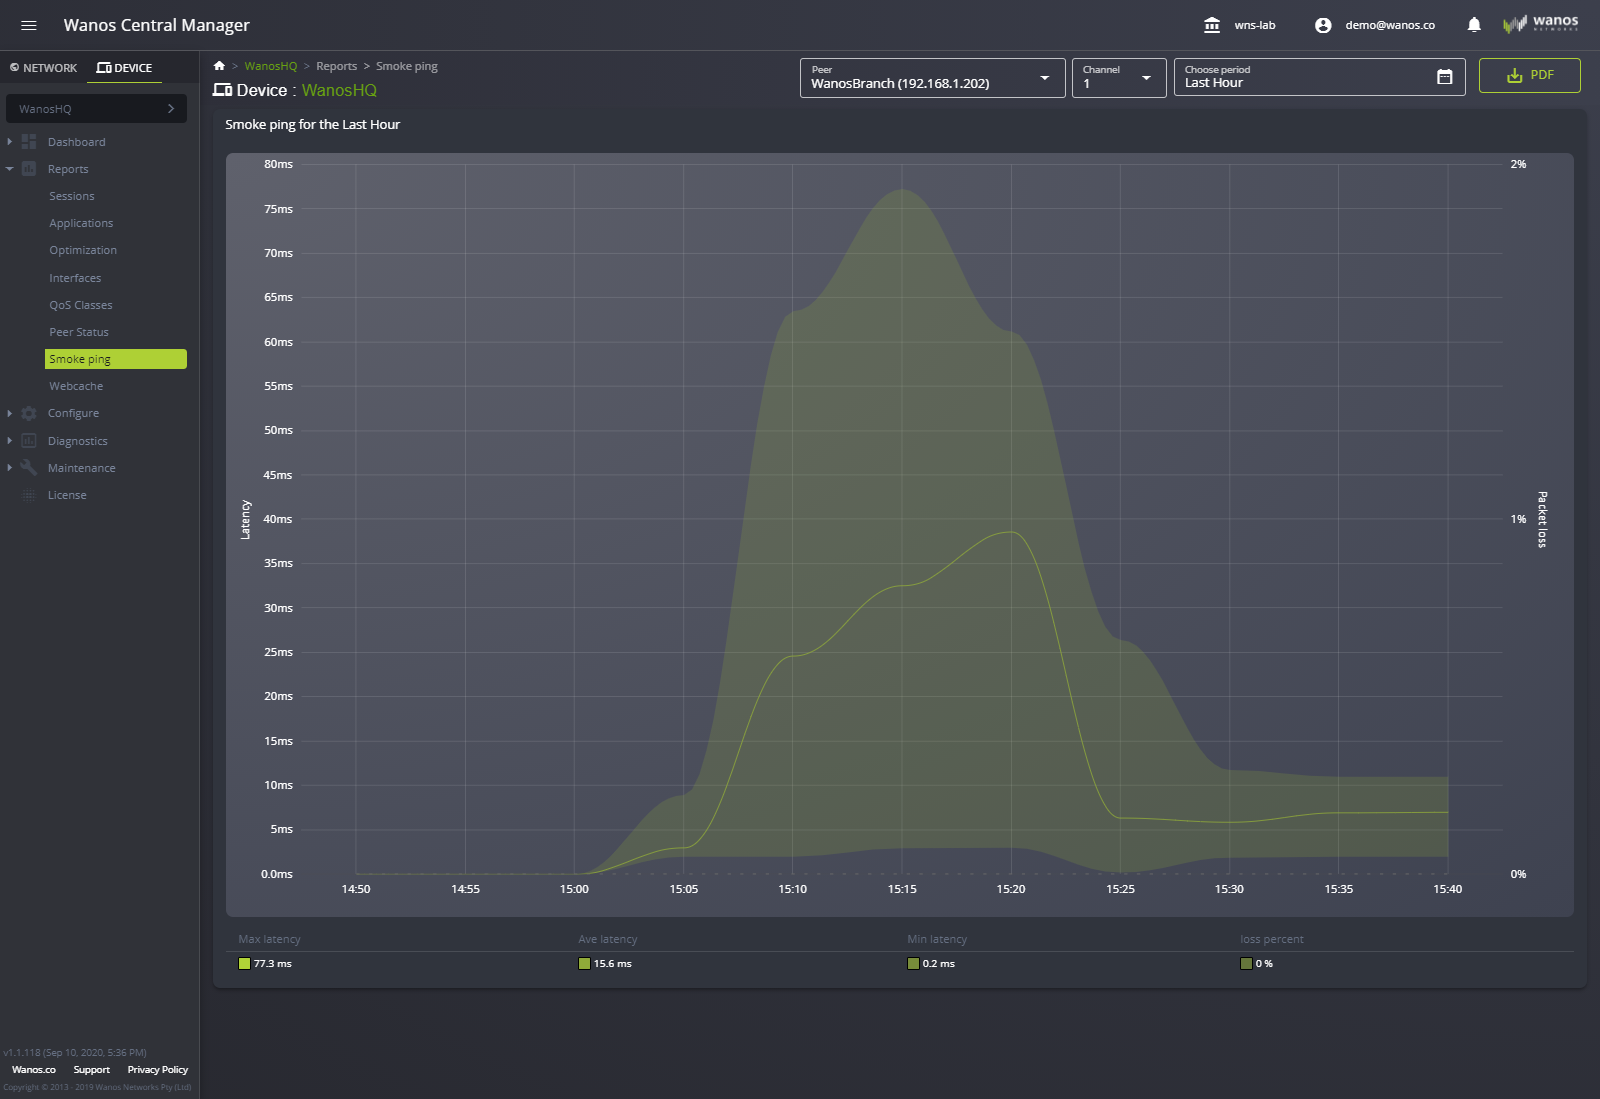
Smoke ping
It is an SLA tool that monitors the latency and packet loss between peers.
It provides the user with the Maximum latency, Average latency, Minimum latency, Percentage loss, list of peers available, and channel. Administrators can select the period of which can display specific data. An option to export the report into PDF format is also available.
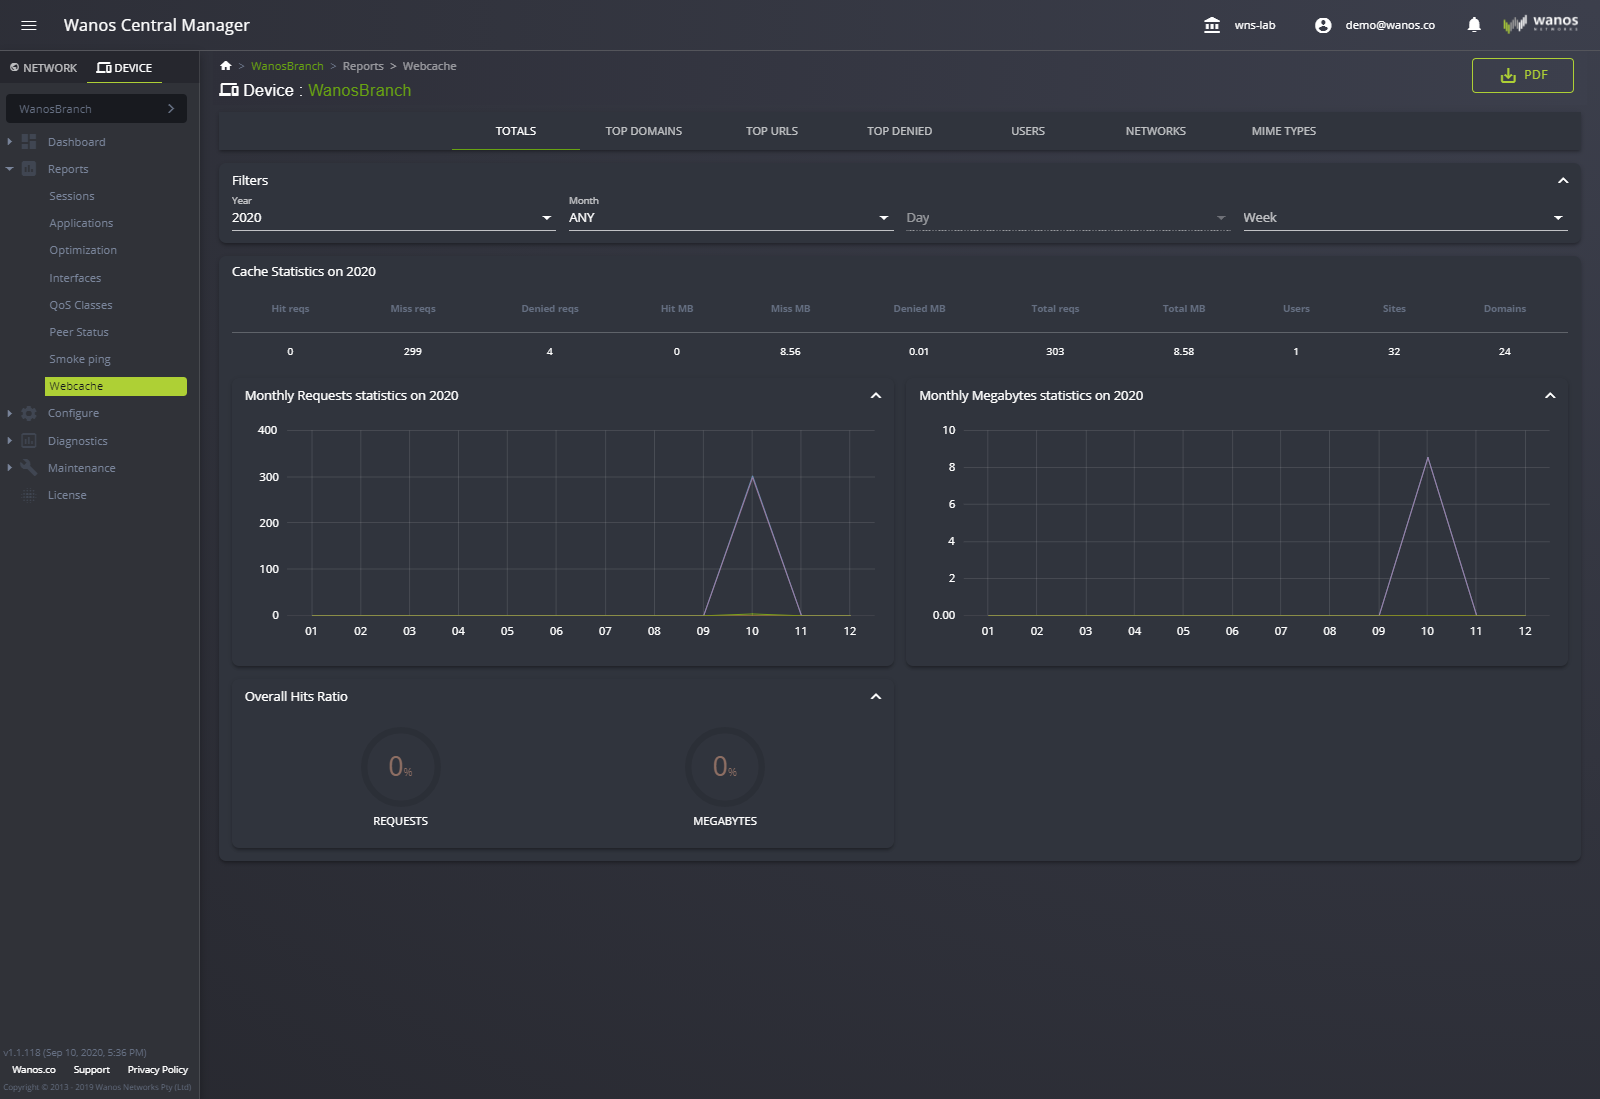
Webcache