Author Topic: Checking reduction rate and reporting tools  (Read 5434 times)

lexyus

  • Full Member
  • *****
  • Posts: 34
    • View Profile
Checking reduction rate and reporting tools
« on: November 24, 2014, 10:04:02 AM »
I already installed wanos in 2 PCs and already place it on two of my linking sites. one sites using 192.168.6.XXX ip range dan the other one using 192.168.7.XXX ip range.

I was read on tutorial that point-to-point sites doesn't need much configuration, so i just change the PC ip based on the sites ip range (one wanos with 192.168.6.41 and the other wanos using 192.168.7.41) and leave other with default settings.

Now I'm curious, how am i know now that reduction and caching function is already working? because it's doesn't make much difference when I try to copy data between sites or just querying SQL from one sites to another.

or did i miss some setting or some other things?


and where can i found reporting function to collect reports? e.g. traffic per users, users with most bandwidth, apps with most bandiwidth, and so on.

thanks before for the reply

ahenning

  • Team Wanos
  • Administrator
  • Full Member
  • *****
  • Posts: 629
    • View Profile
Re: Checking reduction rate and reporting tools
« Reply #1 on: November 24, 2014, 03:16:32 PM »
Hi Lexyus,

Ok for the first question. Yes, in the point to point link there is not much to configure, except for the ip addresses to see the stats and you can also set the Optimization level to 'High'. Currently the default is low, but the default will change to high in the next release.

If the two sites are connected via an Ethernet cable then there is not really a WAN, so you can enable the WAN Simulation option which will rate limit the wan0 interface to 1 Mbps. Then it is possible to do some tests and see the difference.

To check the optimization stats have a look at Reports -> Network. There are Protocol, Session, Optimization, Peers and Interface stats. Attached are a couple of examples of what you should be seeing in the reports:

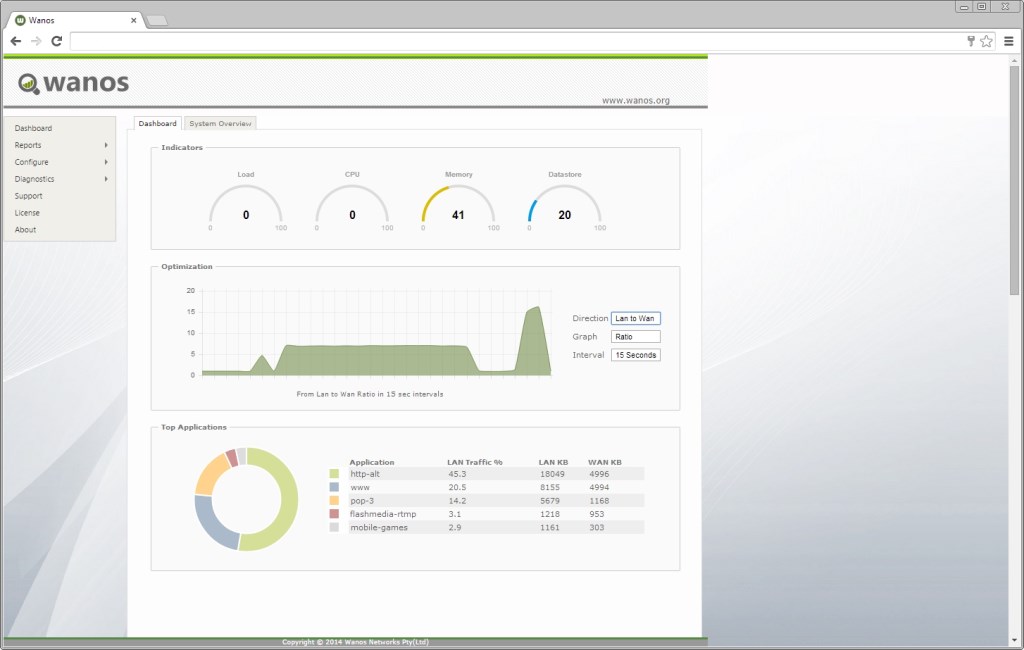
The Dashboard can be used for general idea. The live graphs shows Optimization ratio. A value of 20 means traffic has been reduced by a factor of 20 or 20X. The KB Saved can also viewed. Either traffic direction can be selected. There is also a quick overview of the protocols:


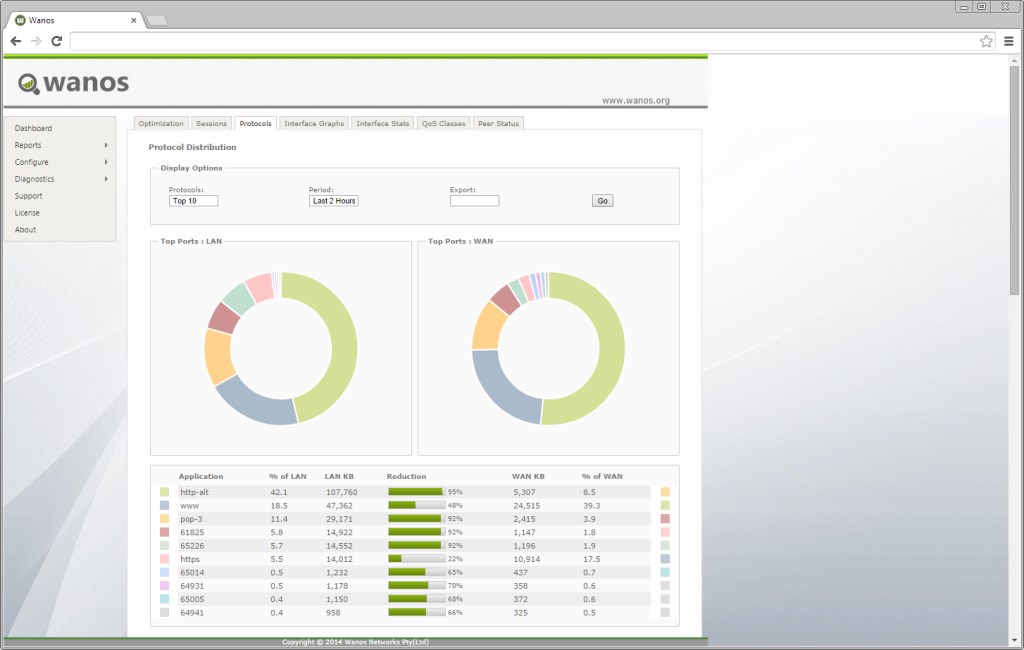
To view the protocols, select Reports > Network > Protocols. It displays the Top 10, 20, 30 or 40 protos/ports/applications used and the breakdown of each. Time frames are 5 minutes to 24 Hours currently:


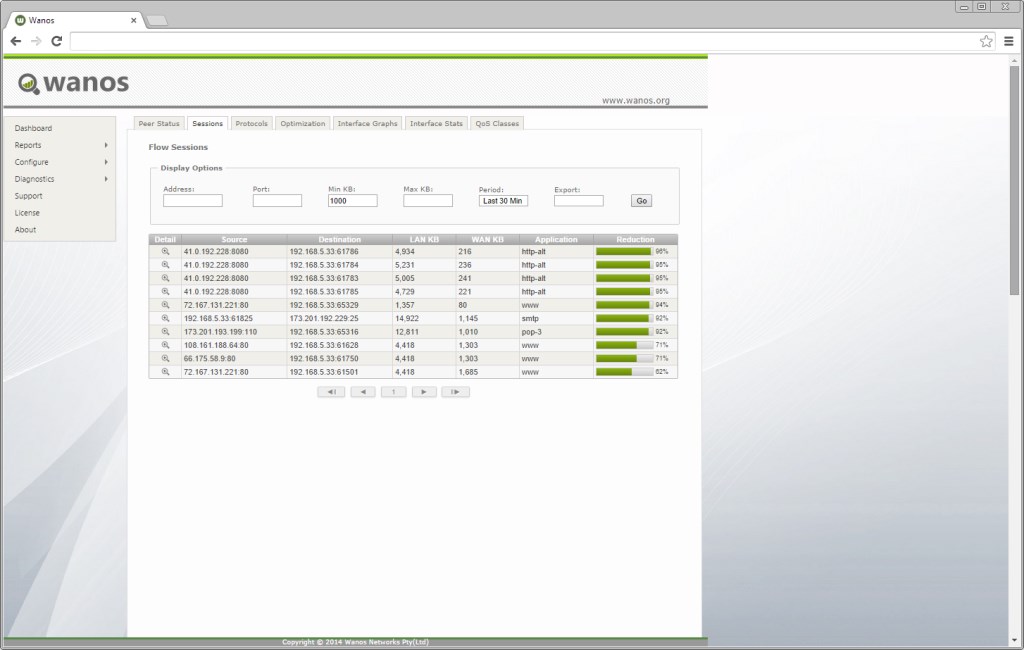
To view the traffic sessions or top talkers select Reports > Networks > Sessions. It displays the source and destination addresses and ports. The total traffic volume and the percentage reduction:


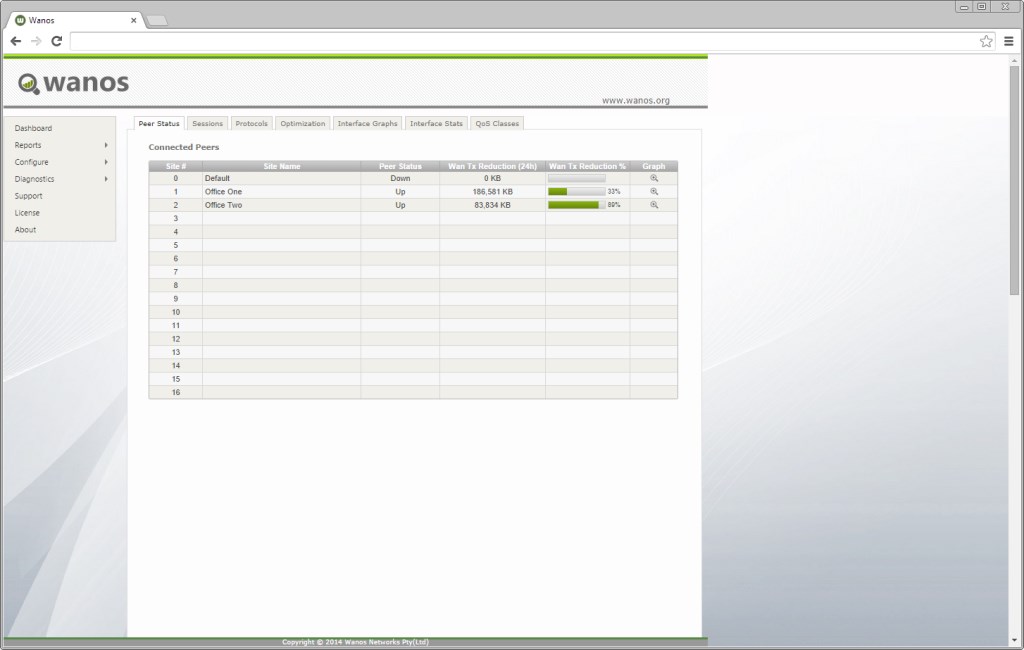
To view the status of the connected peers select Reports > Networks > Peer Status. It displays the configured sites, whether the local device is ready and whether the remote peer has been detected. It also provides and overview of the reduction stats for the last 24-hours:


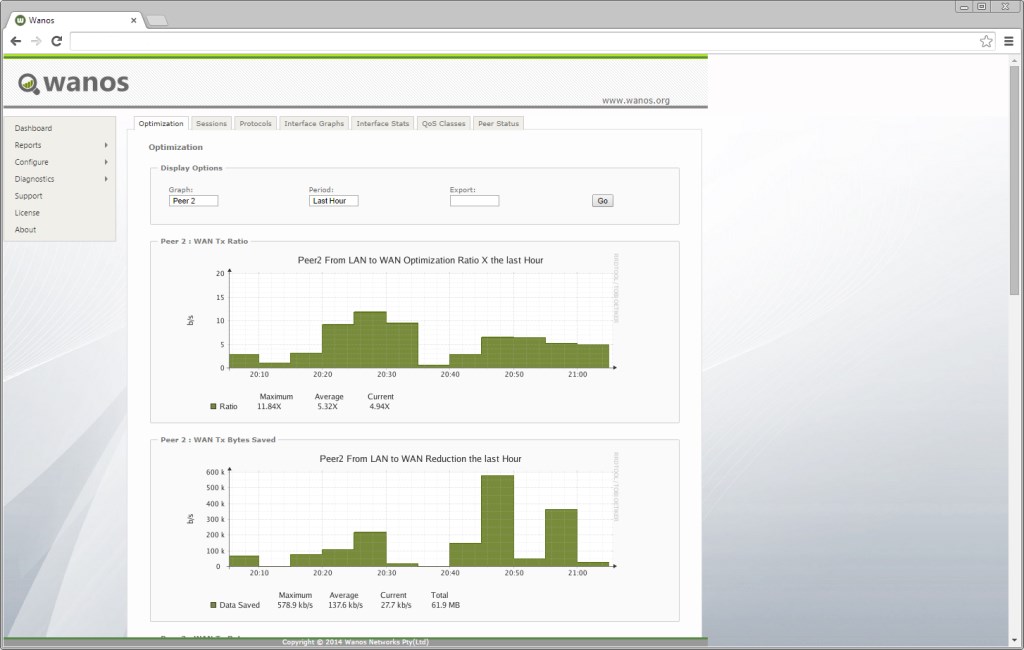
There are also graphs to display the Optimization Ratio over time. For example a ratio of 5x would mean traffic has been reduce 5 times. If the WAN link was for example 10 Mbps, this would translate into 50 Mbps throughput:


There is also the System Overview tab to display the total amount the appliance has saved:


Hope it helps.
CCIE RS, CCIE SP, Mnet&sys

Note: Forum posts may be outdated. Please see the latest documentation at wanos.co/docs

ahenning

  • Team Wanos
  • Administrator
  • Full Member
  • *****
  • Posts: 629
    • View Profile
Re: Checking reduction rate and reporting tools
« Reply #2 on: November 25, 2014, 06:27:23 AM »
Hi Lexyus,

I moved the Mikrotik PPTP VPN post to: http://wanos.co/forum/index.php?topic=127.0

Regards
A
CCIE RS, CCIE SP, Mnet&sys

Note: Forum posts may be outdated. Please see the latest documentation at wanos.co/docs

lexyus

  • Full Member
  • *****
  • Posts: 34
    • View Profile
Re: Checking reduction rate and reporting tools
« Reply #3 on: November 25, 2014, 06:30:03 AM »
noted ahenning, will follow up to new section.